Wednesday, December 11, 2013

Low Car Friction Lab

Hey guys, so yesterday we did a low friction car lab in physics. That was pretty amusing... You'll get what I mean later. First, we laid a 2m ramp (high-low) across our desk. Along with that, we used a metronome and for those who don't know what that is, it is an electrical instrument that makes repeated clicking sounds at an adjustable pace (musicians use these). We set the pace at 120 hocks. Then we took our low friction car and located it at the high end of the ramp. There as it slid down, Alex (one of the lab group members) marked on the ramp, for every hock that ticked. We needed at least 5 data points.
 
 
Low friction car

Data


When we first began this experiement, we screwed up, so that was pretty hectic (that's why I mentioned it was amusing). We didn't measure the position of the car, but instead, the distance between two points. Anways moving on, as you can tell, the prediction my group came up with was correct. During the white board discussion, there was one group that had problems with their graph. We said that they could've pushed the car slightly, or their calculations might have been off (human errors). Continuing on, our class came to the consensus that the velocity vs. time graph would be a diagonal line because the car gets faster as it goes down, which results in the slopes changing. The velocity vs. time graph could not be a straight, horizontal line because it was not going at a constant speed. Lastly, we concluded that this graph was a polynomial graph because it had a curve, as it was going up.

Reflections: This experiement was alright. I thought the class discussion was very boring and confusing towards the end. Mr. Battaglia was writing things on the board and I wasn't very sure. I didn't ask questions during the discussion, which I should've. My mistake.

That's about it guys, thanks for reading!

Saturday, November 30, 2013

Velocity vs. Time Graphs & Displacement WS 4

Guys, I'm back! How's your thanksgiving break so far? My schedule has been packed, but I'm having tons of fun though. I'm a little disappointed that breaks almost over. :( It's so unfair! I wish it was two weeks long. That would've been awesome! Well anyways, let's get back to physics! My class had a white board discussion last week on Friday. We did not go over the whole packet because there wasn't enough time. I might have not covered all the information here because I wasn't in class for the first 30 minutes. Anyways, the two sheets we analyzed as a class are provided below.

Part 1
 
Part 2
 
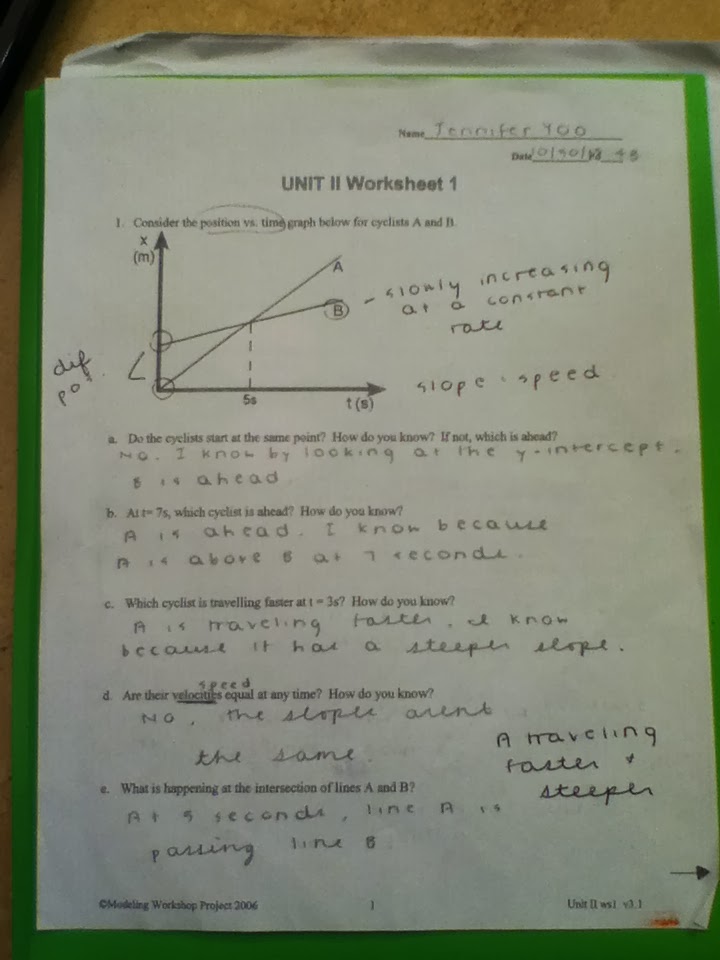
Part 1.) One of the things my class came to the consensus was that the reference point could be any point on a graph. It does not always have to be at the origin, or the starting point. We also agreed that the cross hatched area on the graph from question 1c represented the total distance traveled by the object. Part 2.) We didn't talk about this one much. We all came to the agreement that for 2d and 2e, all you have to do is count the boxes within the given time. For 2f and 2g, my friend helped me step-by-step on how to determine the average velocity and speed. By the way, we did not go over these ones in class. 2f.) (Formula= final position- initial position over time elapsed) First, figure out the final position the object was at 8 seconds. Then find the initial position at 4 seconds. Take the final position and subtract that by the initial position. (5-7= -2) Lastly, divide that number with the time elapsed, which was 4 seconds. (8-4=4) The final answer you should get is -1/2 m/s. 2g.) (Formula= distance over time) First find the slopes between 4-5 seconds, 5-7 seconds, and 7-8 seconds. In order to find the slope, you must do rise over run. The slope of the first time is 3, the second one is 0, since the object was not moving, and the slope of 7-8 seconds is -5. You must add 3 and 5. Remember, distance can never be negative, so you don't subtract. After you add those two, you divide them by 4. (8-4=4) Your final answer should conclude to 2 m/s.
 
Reflections: Our class discussion was pretty horrible... There were people arguing and debating whether or not the answer was right. We were literary on the same topic for almost an hour. Not joking. As you can tell, we didn't get that far. Furthermore, the discussion was pretty confusing. When someone asked a question, it was answered unclearly and they just rambled on. My teacher was also pretty upset and yelled at us. 
 

Wednesday, November 6, 2013

Unit 2 Worksheet

Hey guys! We just recently did a worksheet in class this week and I wanted to share it with you all. I really don't have much to say because the answers are provided on the worksheet. Ask me any questions if you don't understand it!


Part 1


Part 2

Recoverd!

As you guys can see, I got all of my posts recovered! They'll be up and going, so no worries guys! :) I'm just really happy I got these back, thanks to a stranger who helped me!

Re-upload: Our so called, "fiesta"

Hey guys! Apparently this my third post... To be honest, I'm not sure what we did in Physics class over this past week... I remember like a thing or two, but that's it. The only thing that sticks out to me right now (I'm extremely tired) is that we took an assessment, or our so called, "fiesta". I didn't score very well, but I mean, at least we get multiple chances to re-take the test, so we can raise our grade up. I guess I'll be okay, I think... At the end of the day though, it really depends on how much effort you put into your work and whether or not you understand the concept.
 

 Our "fiesta"


It may look like I did good on it, since there's not many marks, but if you look on the top left-hand corner, my teacher graded us from 1-3. 3 being the highest and 1 being the lowest. Well technically 0 is, but I mean that's if you literally didn't put anything down on your paper. 5,6,7,8 and 9 are the standards or concepts we needed to know for our "fiesta".


Standards/Concepts

I did well on identifying the dependent (y) and independent (x) variables and graphing the data. I would've gotten the mathematical model right if only I used different variables. I totally forgot that the teacher said we couldn't use the x and y variables. Oops! Well either way I also forgot that we had to label which varibale stood for which. I screwed up on the last question, well not completely I guess. The coefficient is wrong, the y-intercept wasn't labeled at all, and my "for every" statement is incorrect also. I did get what type of relation the graph was and whether it increased or decreased correct. I think I'll do better on my next "fiesta" if I prepare a bit more and if I get more time in class to complete it. Yeah... We took this towards the end of the class period, so I started rushing on it. It was so nerve racking.

Re-upload: Direct, Indirect, Proportional & Inverse

Hey guys, this is my second post! I hope you enjoy reading it! During my physics class, we discussed about direct, indirect and proportional relations. A direct relation is when x increases, then y also increases or if one decreases, then the other also decreases. The numbers do not have to be constant, meaning if x increases by 2, then y can increase by 3. They don't have to increase or decrease by the same number. We also said that the line on the graph would be linear and consistent. It does not always have to pass the origin.
Direct
 
The meaning of indirect obviously means not direct. For an indirect relation, we came up with, as x increases, then y would decrease or vice versa. The numbers also do not have to be constant. The line would be a negative slope.
 
Indirect

Proportional would be a constant relationship between x and y. When x doubles or triples, then y would also double or triple. The line on the graph would be linear and consistent. It must always pass through the origin.
Proportional
 
We haven't got to inverse yet, but I did make a prediction to what it is. I believe it's when x is doubled, then y is halved.
Inverse
 

My thoughts: Our class discussion actually helped me a ton and my teacher was able to help us with bits and pieces. I also participated a lot more than I expected and asked some questions. To be honest, I'm not really a risk taker. I find it very hard because I'm afraid that I won't get the answer right and people will laugh at me. I'm just really happy and proud of myself for stepping out of my comfort zone and being able to be involved in the class discussion.


Re-upload: Rod & Hexnut labs

To start off, my name is Jennifer Yoo and welcome to my blog! There will much more to come, so check daily! This is my first time actually writing a blog, so it might not be great, but I'll try my best to improve over the course of the year. During the first few weeks of school, we did multiple labs with our groups. After finishing all the labs, we had class discussions and explained what our equation was, what went wrong, and what type of graph we had.

For the rod lab, our group measured different size rods and the mass of each one on a triple beam balance scale. The question we were given was, "How does the length of a rod affect its mass?" The hypothesis we created was that as the length of a rod increased, the mass would also increase. Our group thought that this graph was linear because the slope was consistent and had a direct relationship. We did try other graphs such as polynomial and quadratic, but the line didn't fit as well as linear. I think we did have some miscalculations because our y-intercept should have started at 0 not 0.1522, since there's no rod to begin with.
In conclusion, as the length of a rod increases, the mass also increases. 
 
The next lab we did was the Hex Nut lab. We were given multiple Petri dishes that held different amounts of hex nuts in them. We then measured them on a triple beam balance scale. The question our group was asked was, "How does the number of hex nuts affect the mass of the container?" Our prediction was that as the number of hex nuts increased, the mass would also increase. We decided that this graph was linear because the line was going in a upward direction consistently. Our class discussed that for every hex nut added, the mass of the Petri dish increased by 7. 16.59 alone was the mass of the Petri dish.


In all, as the number of hex nuts increase, the mass would also increase.
 
My thoughts: I feel like these labs and class discussions help a little bit, but not too much. I'm still a little confused with Physics and the how the whole process works. It's probably because I'm not adjusted to the class yet. I also hope to do well because I'm having a hard time understanding some of the concepts. I think my group and I cooperate well together. Lastly, I hope to learn and understand more as the year advances.

Saturday, October 26, 2013

Deleted posts

 I just wanted to inform you guys that I accidentally deleted my previous posts... I didn't know deleting the posts in your draft would delete them on your blog also! I hope I can quickly recover these! Wish me luck!

Car labs

Hey guys! My fourth post... Sorry for not posting as much as I should be doing. Okay, so today I'm going to be discussing the car labs my class did on Friday. First off, we were supposed to measure the distance of how far our toy car would go in the selected amount of time we chose. We decided to measure how far our car would go every 5 seconds. (mode of car= slow) The amount of time doesn't really matter, some groups did 10 seconds. Keep this in mind though, you cannot stop the car, it has to go all in one run. We recorded at least 5 measurements for our data. Process of our experiment: My group put a long strip of tape on the ground, so we could mark the measurements. We also put a meter stick next to it, so at the end, we could measure how far each mark was away from the reference point (location of where the car started at). I located the car in the middle (between meter stick and strip of tape) and then clicked the on button, as Roxy (group member) timed the toy car. While she was keeping track of the time, she told Joanna (other group member) to mark down the measurements on the tape for every 5 seconds.

Car lab #1
 
 notes that I jot down

As you can see, our data is pretty accurate comparing to what we should've really gotten. We also did the 5% rule and ours passed.

Car lab #2 wasn't much difference. It was pretty much the samething, except our toy car started 50 cm away from the reference point.

Car lab #2
 
notes
 
Our second data was also pretty accurate, except for the last measurement, which was off by 10.
 
Reflections: I actually had a pretty fun time doing this experiment. My group and I cooperated very well together and didn't really have any complications. I think time was only one because we weren't give so much.